
Execution-ready drawings, not rough sketches.
WattPick delivers engineering design for rooftop and utility-scale solar — layout planning, electrical SLDs, stringing, earthing and protection systems, built for full regulatory compliance from day one.
रूफटॉप और बड़े सोलर प्लांट के लिए पूरी इंजीनियरिंग डिज़ाइन सेवा — लेआउट से लेकर सुरक्षा प्रणाली तक।
⚡ Try our Saving Calculator →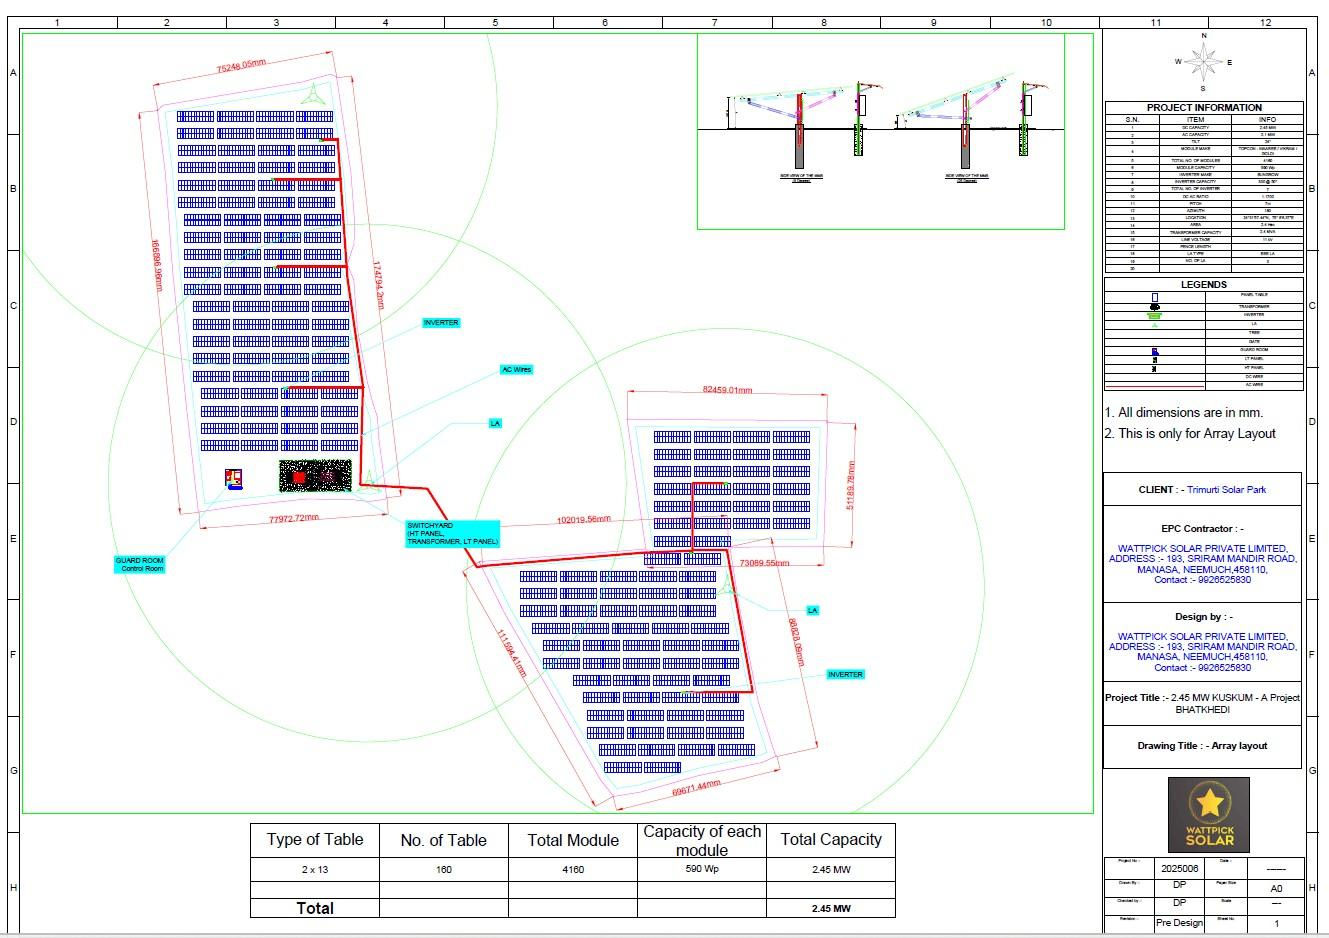
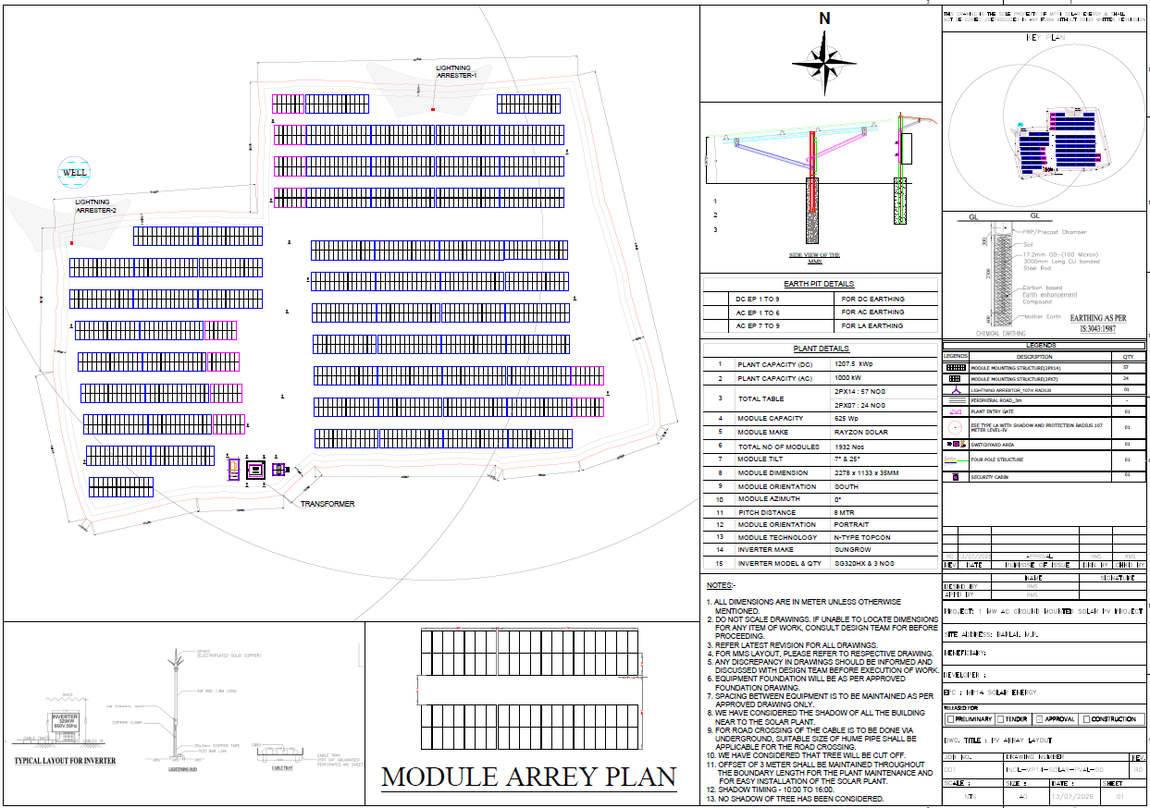
Array layout drawing — Bhatkhedi 1 (2.45 MW), showing table count, module count and total capacity.
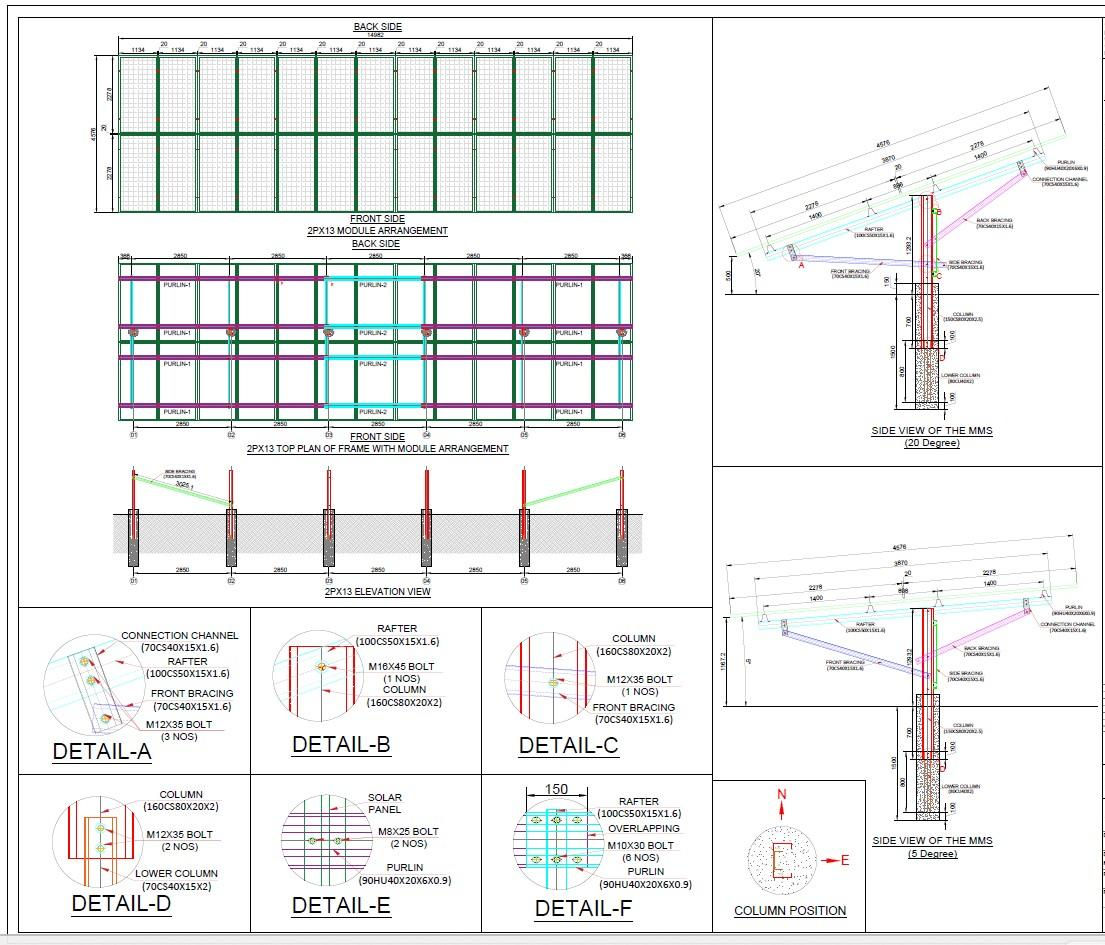
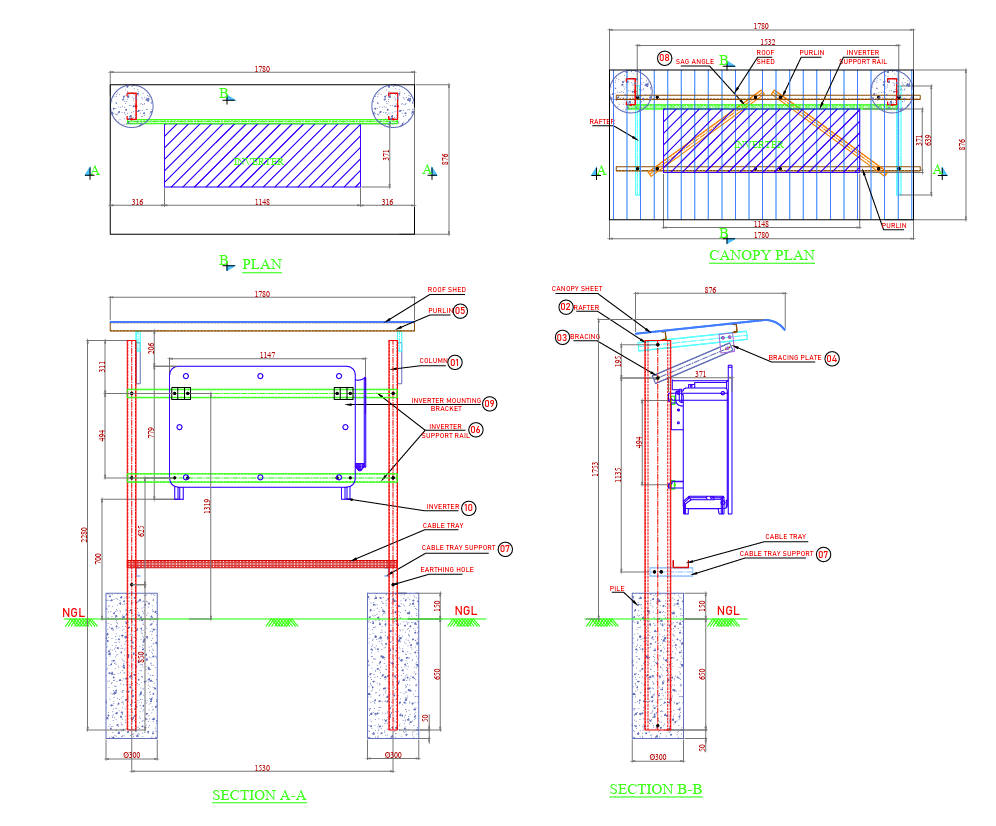
Mounting-structure (MMS) detail drawing, including column, purlin and bracing specifications.
Every drawing type in a WattPick project pack
A full solar EPC drawing set runs across a dozen-plus disciplines. Below is our library, organised by type — filled in with real project drawings where we have one confirmed as WattPick's own work, and marked clearly where we don't yet.
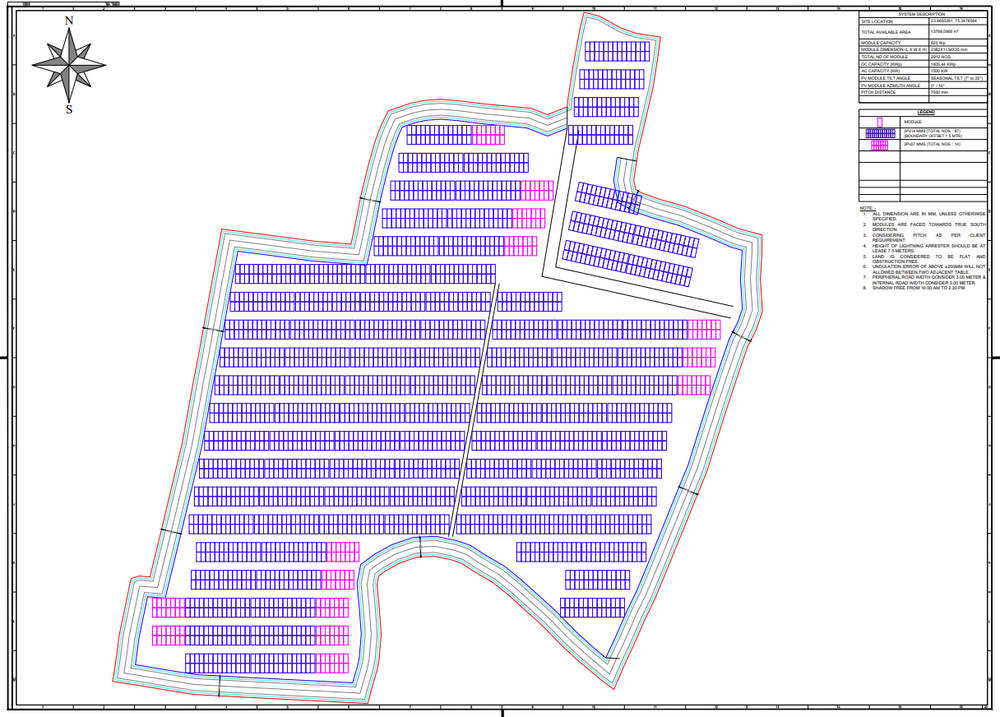
Full array general arrangement — module table layout, boundary and MMS placement, Venkateshwara Solar Park.
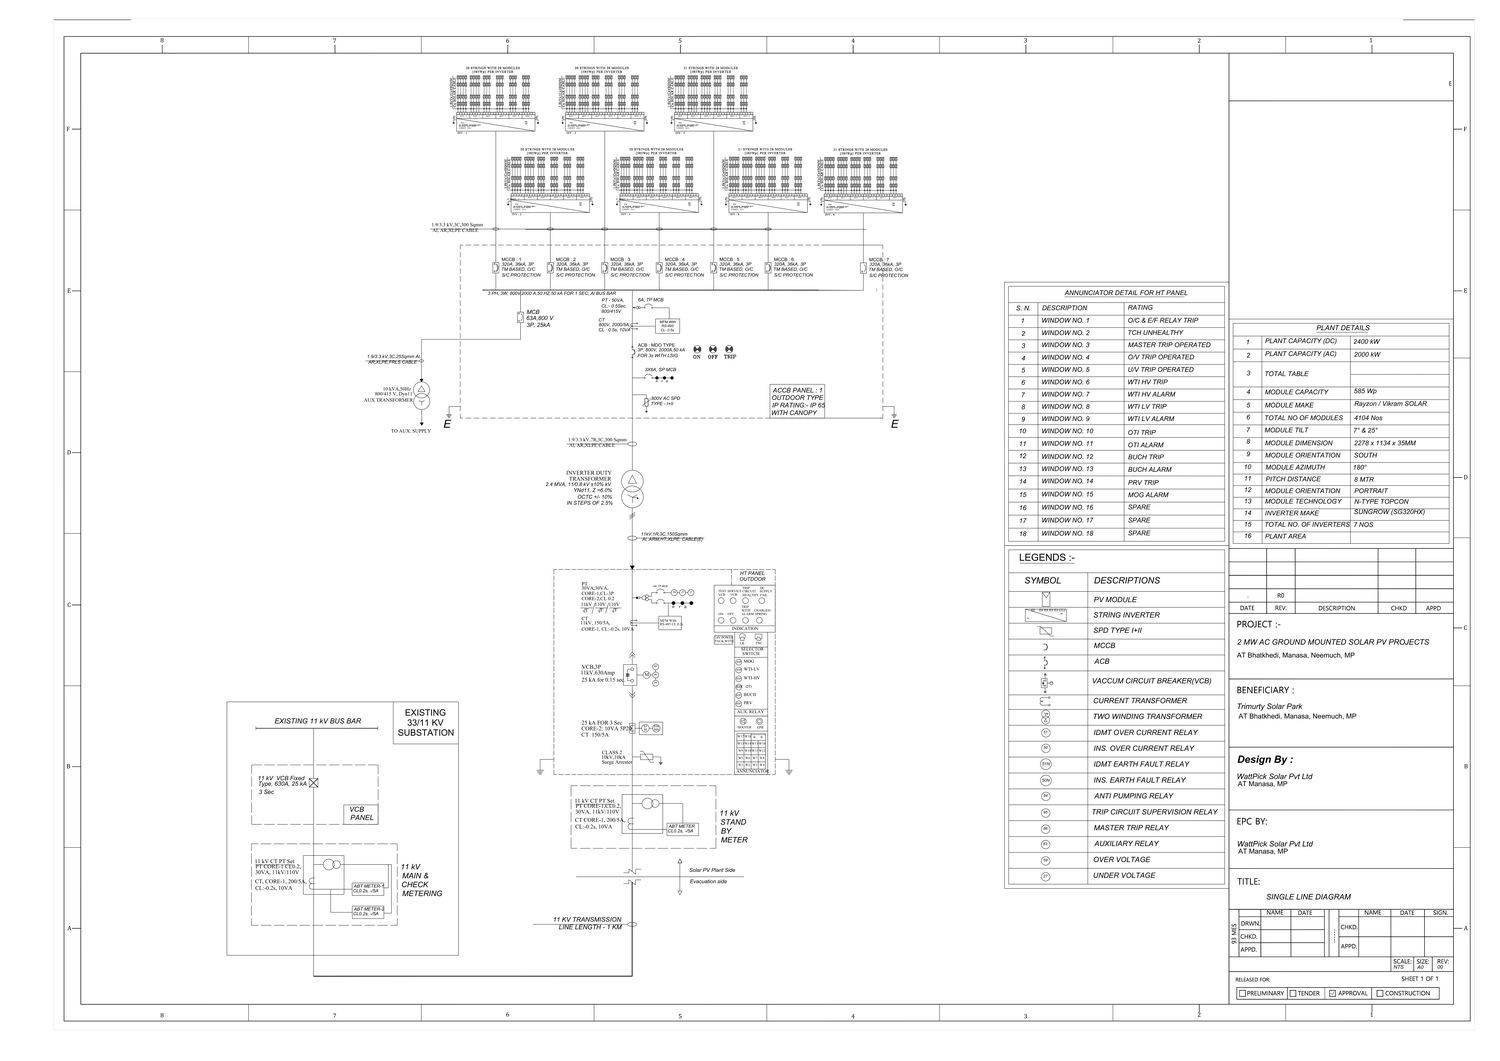
Full electrical schematic from PV array through to the 11 kV grid interconnection point — Trimurti Solar Park, Bhatkhedi.
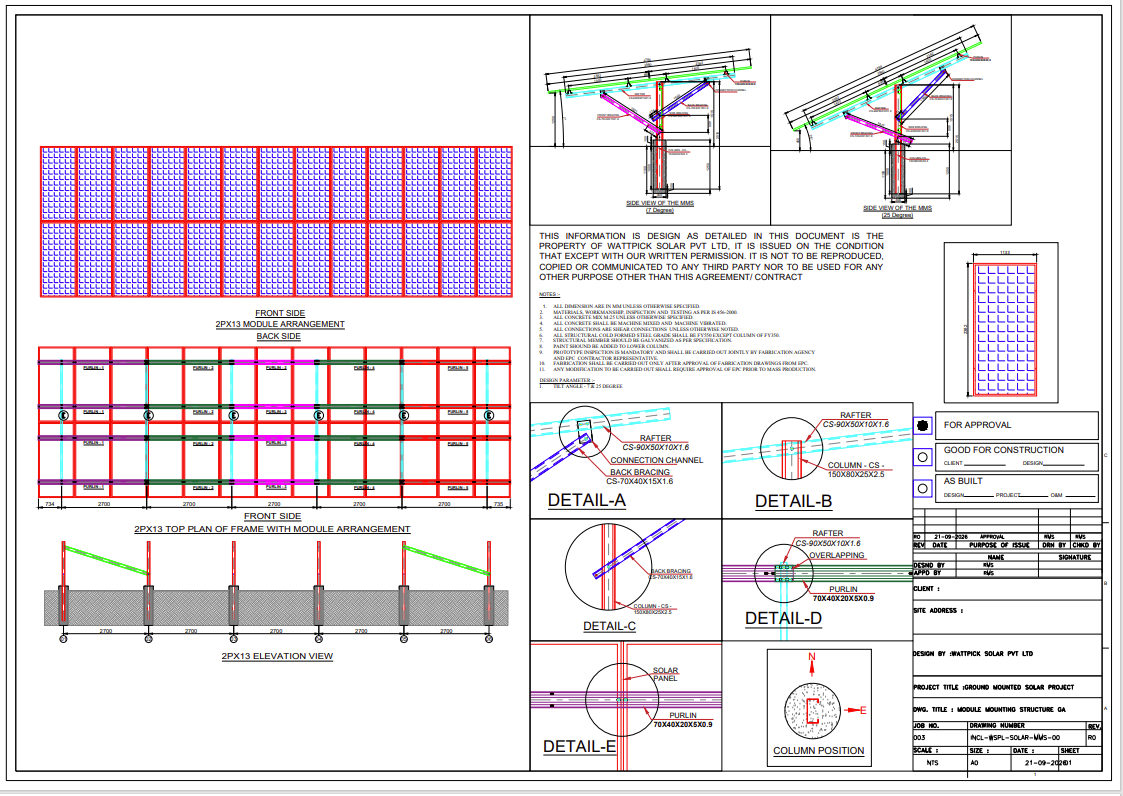
Module mounting structure GA — front/back module arrangement, elevation view and rafter/bracing connection details.
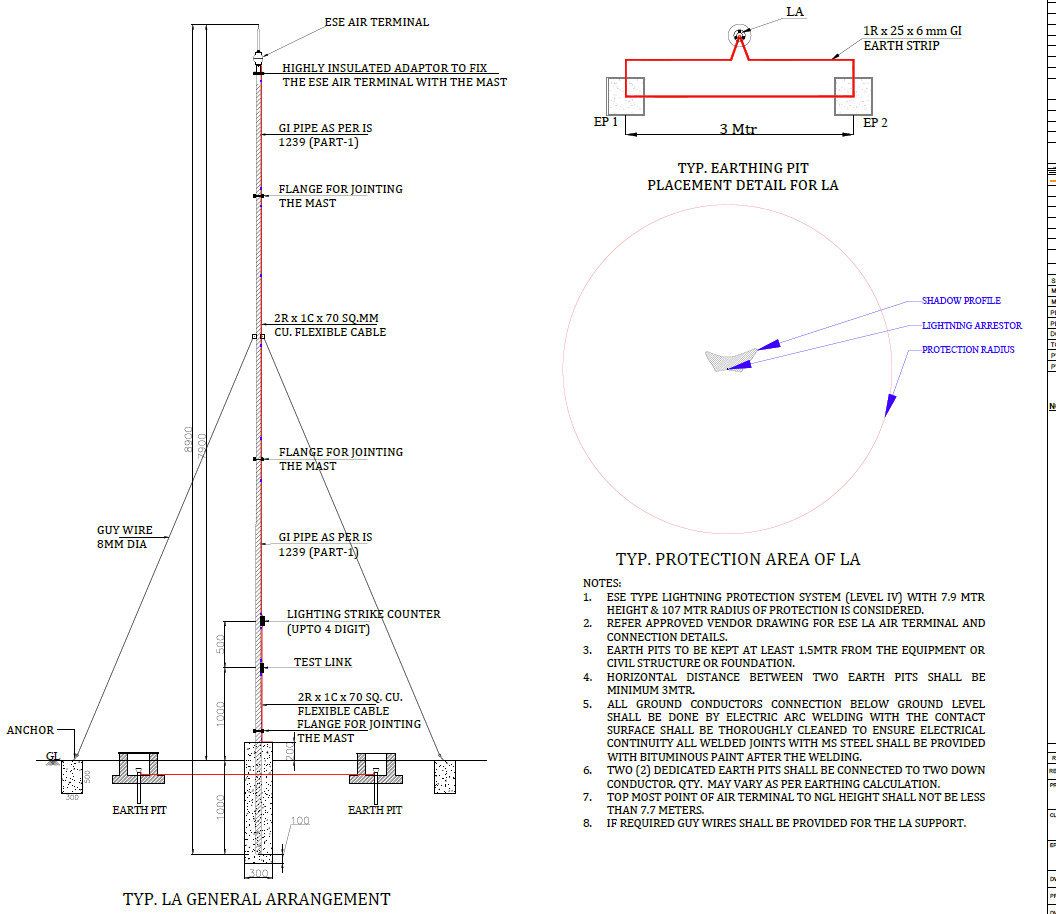
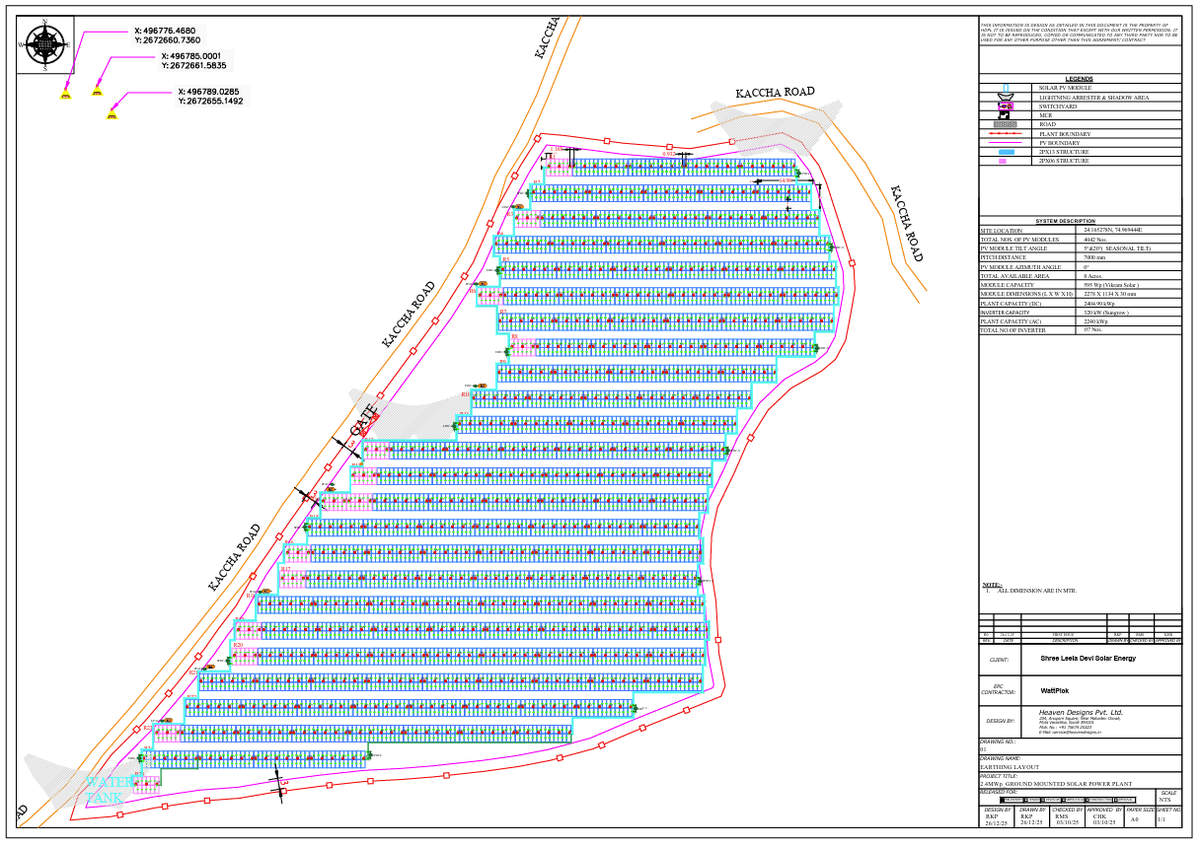
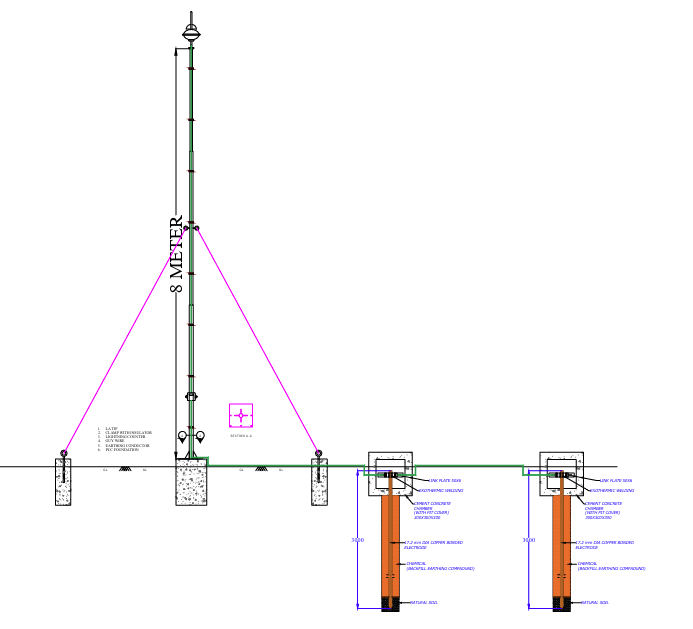
ESE-type LA general arrangement, earthing-pit placement and protection-radius detail per our standard design notes.
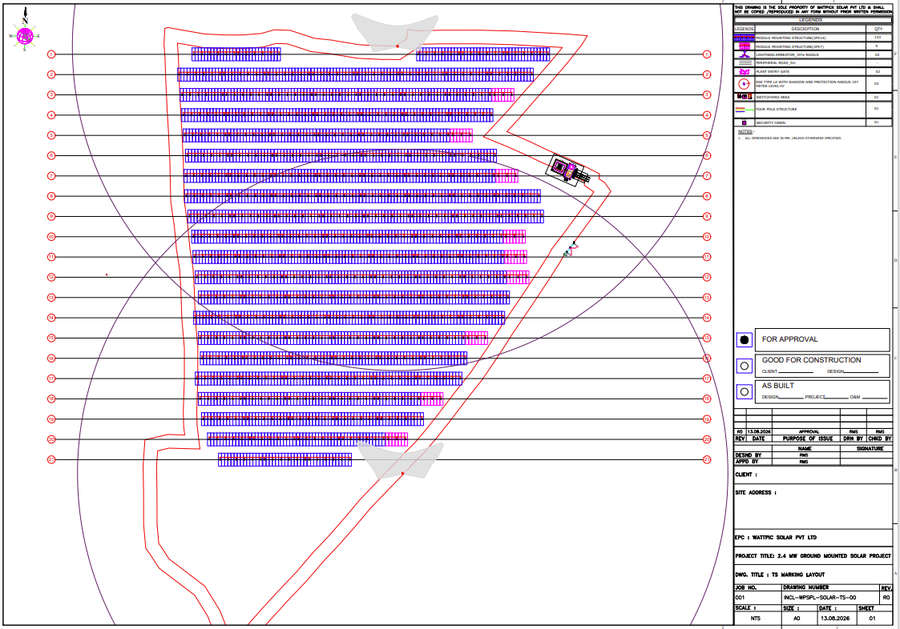
Table-stand and inverter positioning across the array — Laxmi Solar Energy Balaguda 2.
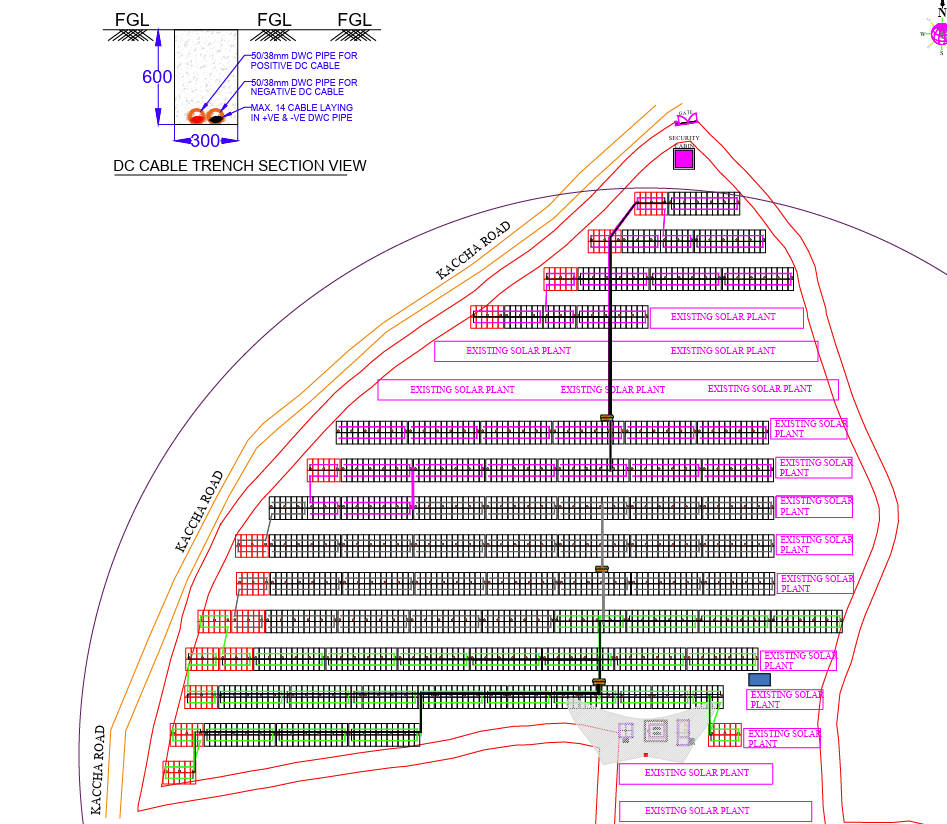
DC and AC cable trench routing across the array — Dalodasagra project (matching schedule below).
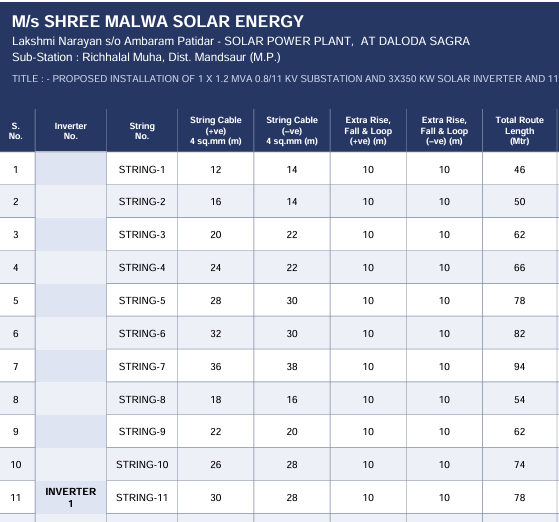
Full DC & AC cable-by-cable schedule on file for Dalodasagra (1 MW) — size, length, route and voltage-drop for every run.
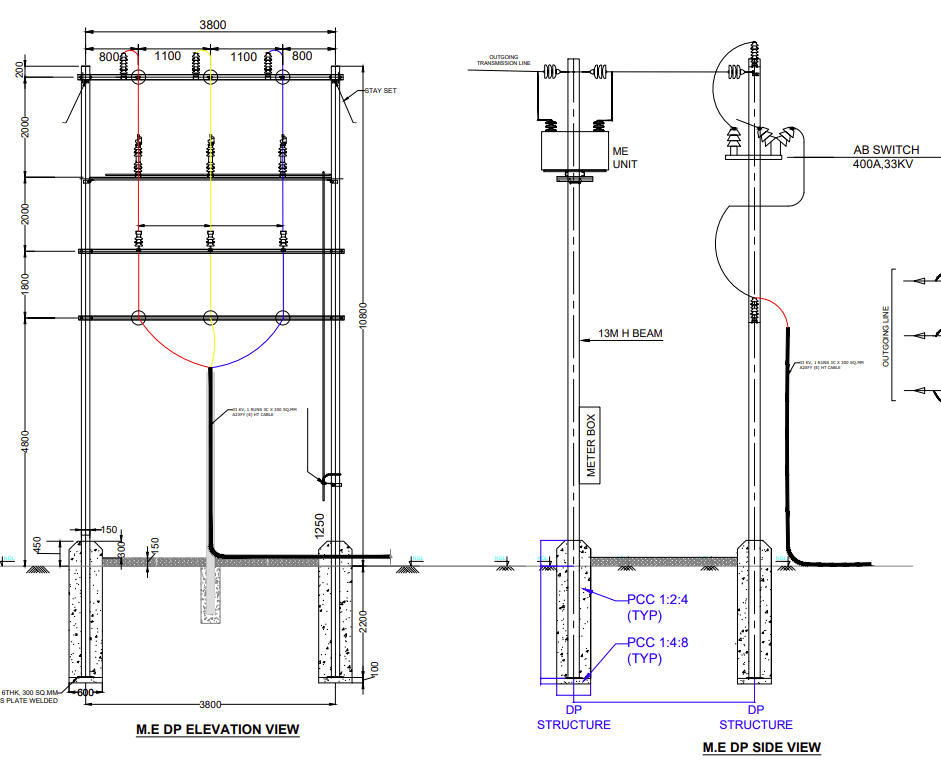
Metering equipment DP elevation & side view — AB switch, meter box and pole foundation detail for Chief Electrical Inspector submission.
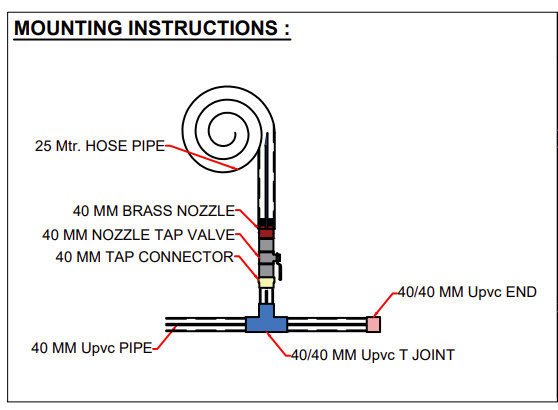
Module-cleaning water line mounting detail — hose, nozzle, tap valve and UPVC pipe/tee-joint layout for the plant site.
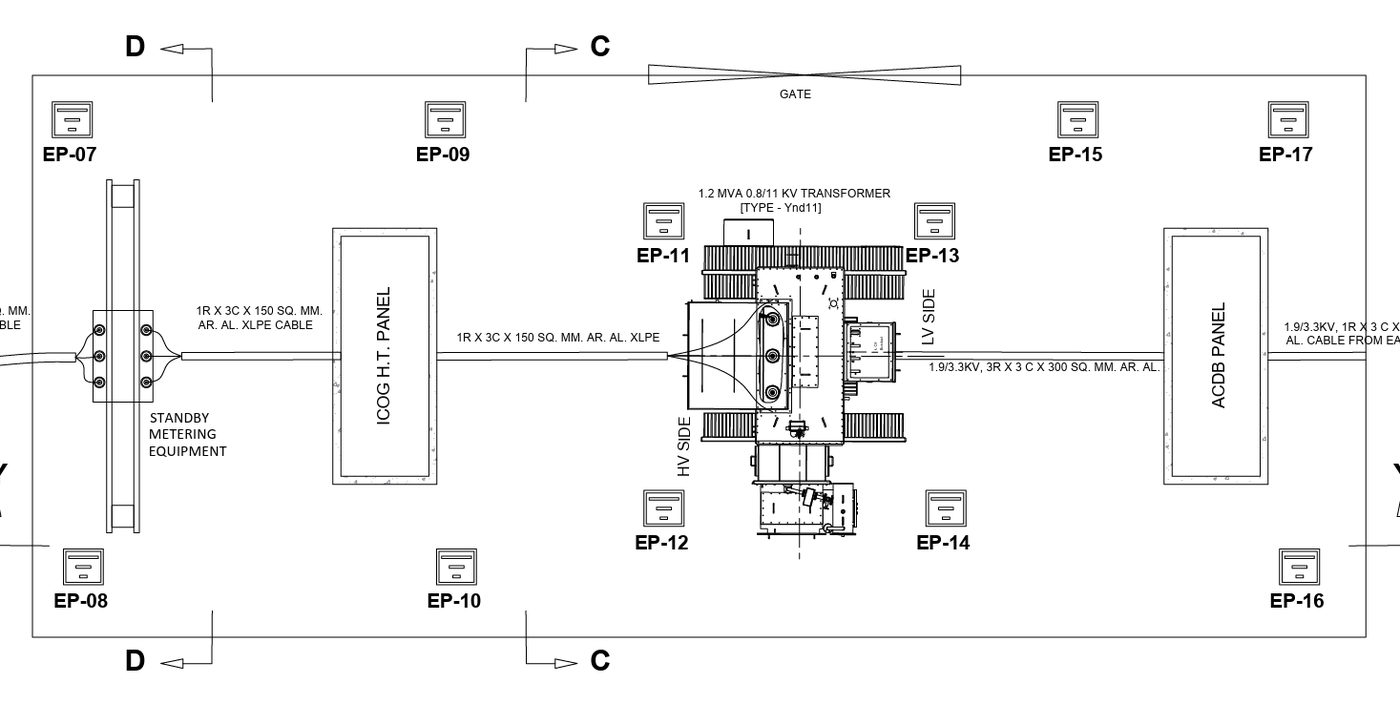
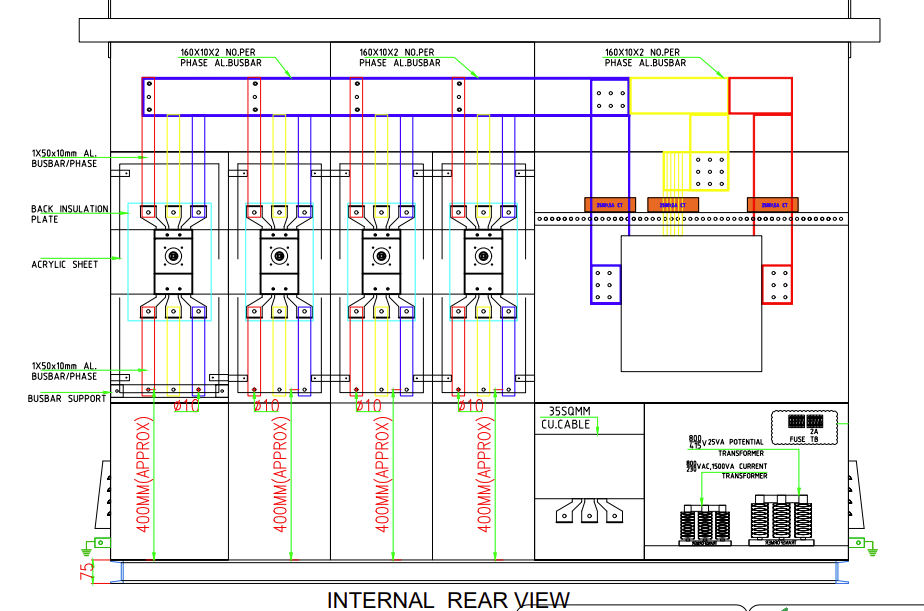
Switchgear, transformer bay and metering-panel arrangement at the grid interconnection point.
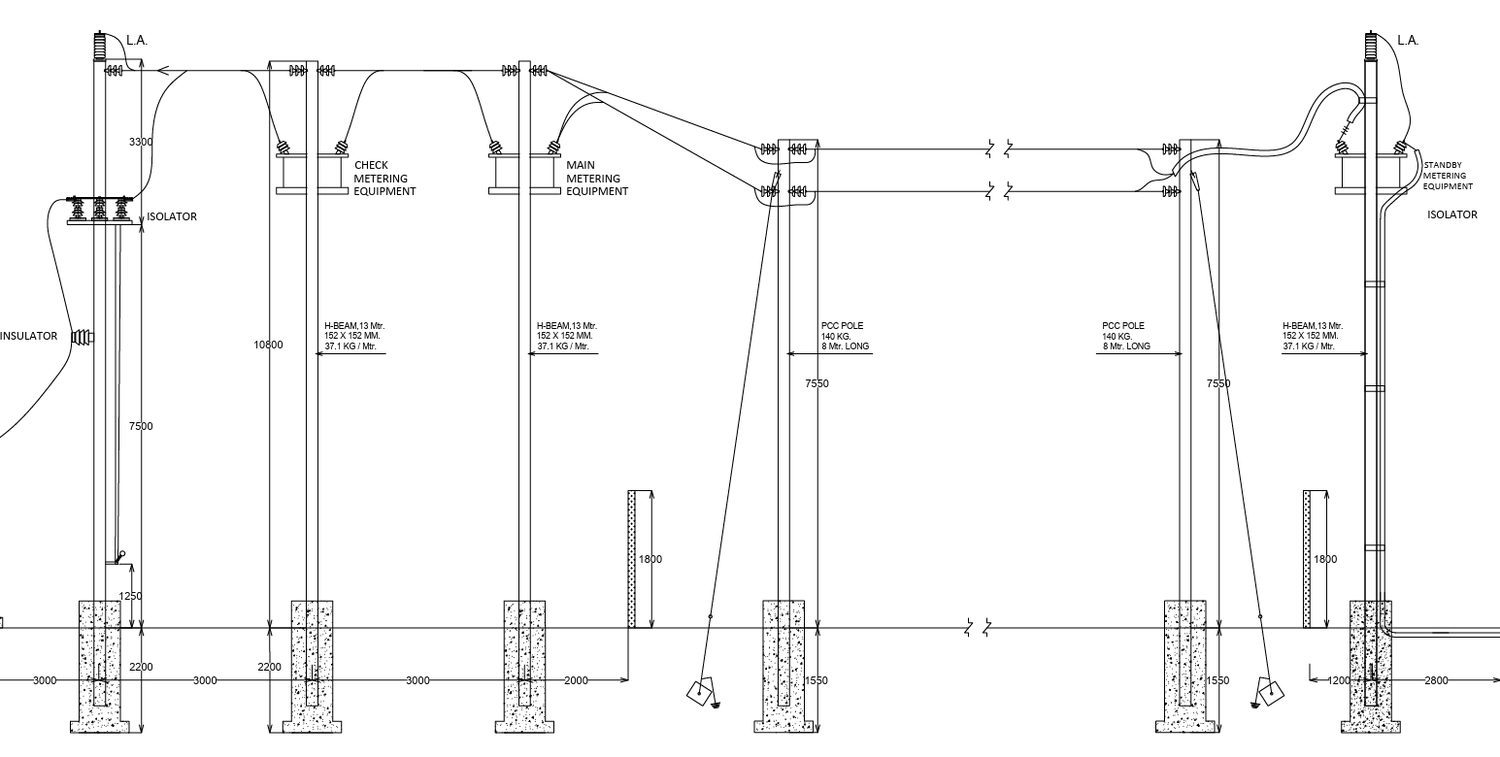
Route profile and pole/tower spacing for 11 kV/33 kV line sections we've erected.
Electrical design document for the Dalodasagra plant (1 × 1.2 MVA 0.8/11 kV substation, 3 × 350 kW inverters). Each of 3 inverters carries 21 strings; a sample from Inverter 1 is shown below alongside the full AC schedule.
| String | Cable (+ve/−ve) | Route length | Cable size | Max. current | Voltage drop | Power loss |
|---|---|---|---|---|---|---|
| String-1 | 12m / 14m | 46 m | 1C×4 sq.mm, Cu XLPO | 14.15 A | 0.37% | 59.77 W |
| String-7 | 36m / 38m | 94 m | 1C×4 sq.mm, Cu XLPO | 14.15 A | 0.76% | 122.14 W |
| String-20 | 40m / 42m | 102 m | 1C×4 sq.mm, Cu XLPO | 14.15 A | 0.82% | 132.53 W |
| Average, Inverter 1 (21 strings) | 0.58% | |||||
| Run | From | To | Cable size | Length | Voltage drop | Power loss |
|---|---|---|---|---|---|---|
| 1–3 | Inverter 1/2/3 | ACCB Panel | 3C×300 sq.mm, AL | 90–110 m | 0.58–0.71% | 0.55–0.68% |
| 4 | ACCB Panel | IDT (LV Side) | 3C×300 sq.mm, AL (×3 runs) | 15 m | 0.04% | 0.04% |
| 6–7 | IDT (11kV) → HT Panel → Metering | — | 3C×150 sq.mm, AL | 7 m each | 0.01% | 0.01% |
Highest AC voltage drop: 0.71% (Inverter 3 to ACCB). Total AC cable length: 334 m. Cable sizes verified for current-carrying capacity, de-rating and voltage drop as per IS 3961 / IS 694 / IS 7098.
Missing a category above that you have a drawing for? Send the PDF and we'll add it in the exact format shown here.
Why every design goes through PVSyst first
PVSyst is the industry-standard simulation software for grid-connected solar plants, used to model a site's actual generation before a single panel is ordered. We run every ground-mounted design through it to de-risk the investment before construction begins.
Site & equipment data
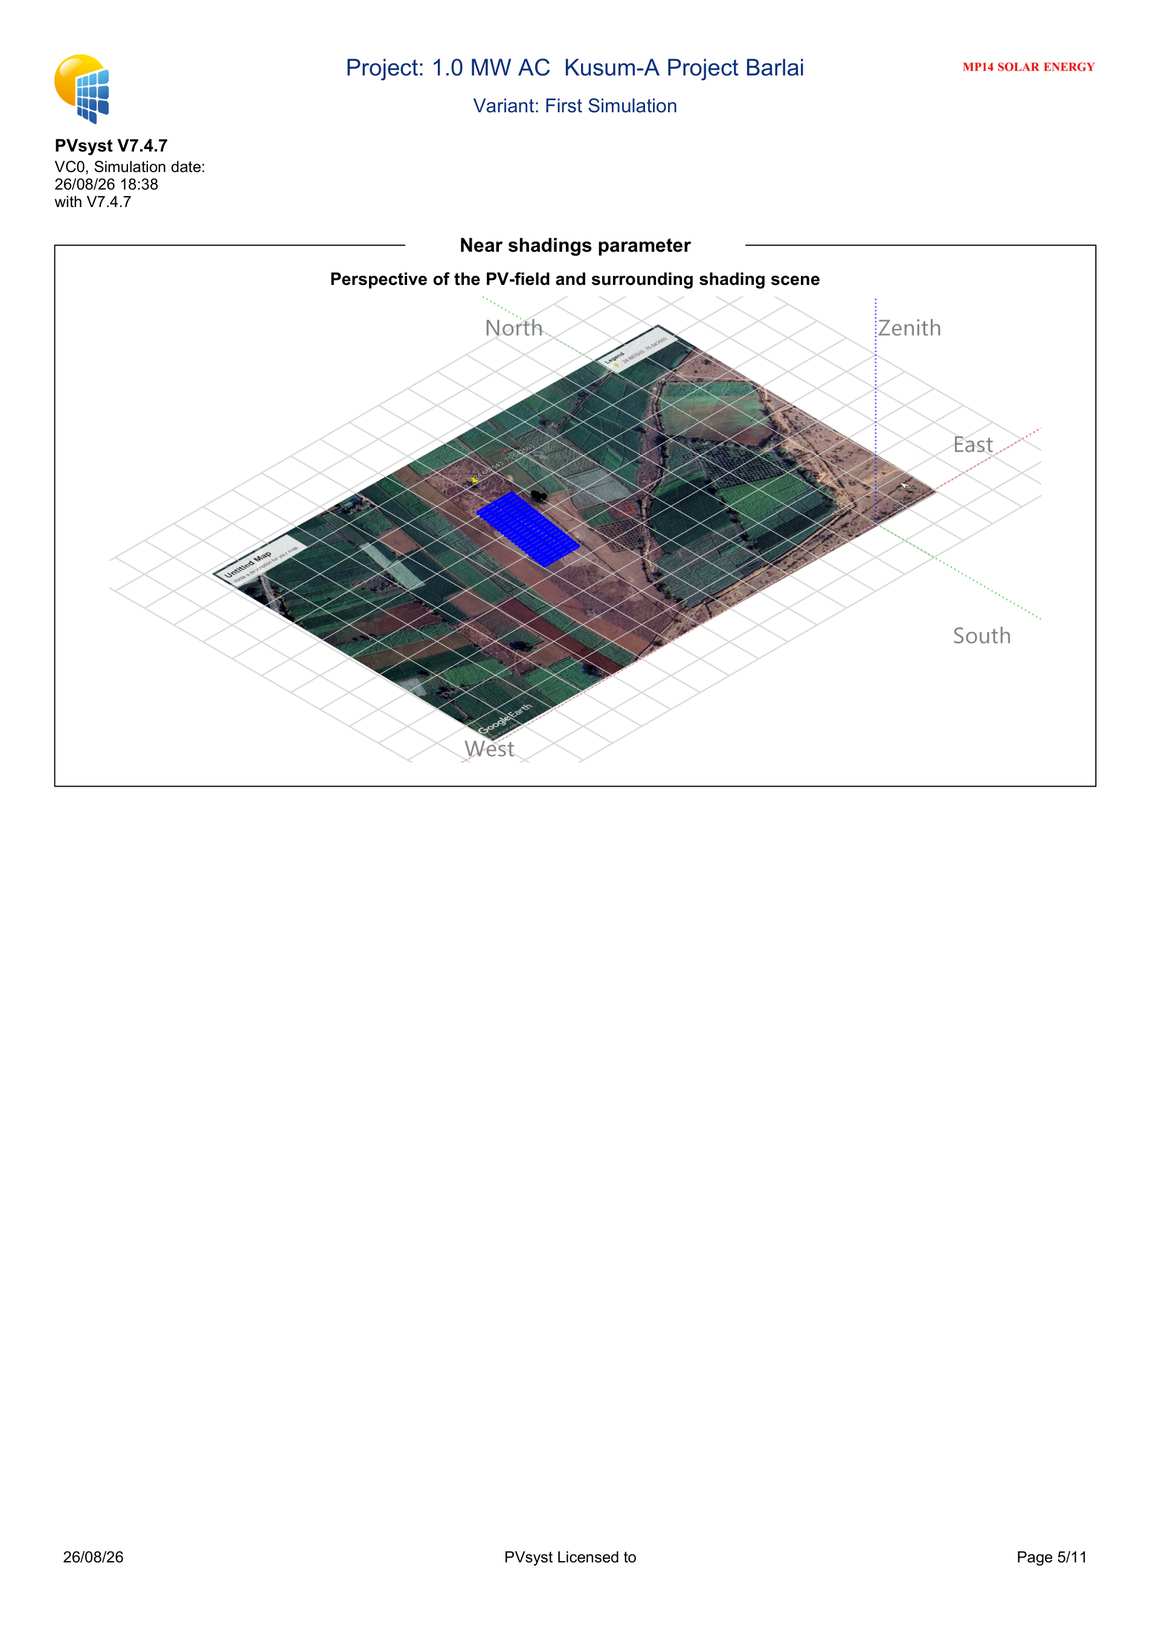
Geo-coordinates, weather data, module and inverter models, tilt, azimuth, row spacing and near-shading obstacles are all modelled before simulation.
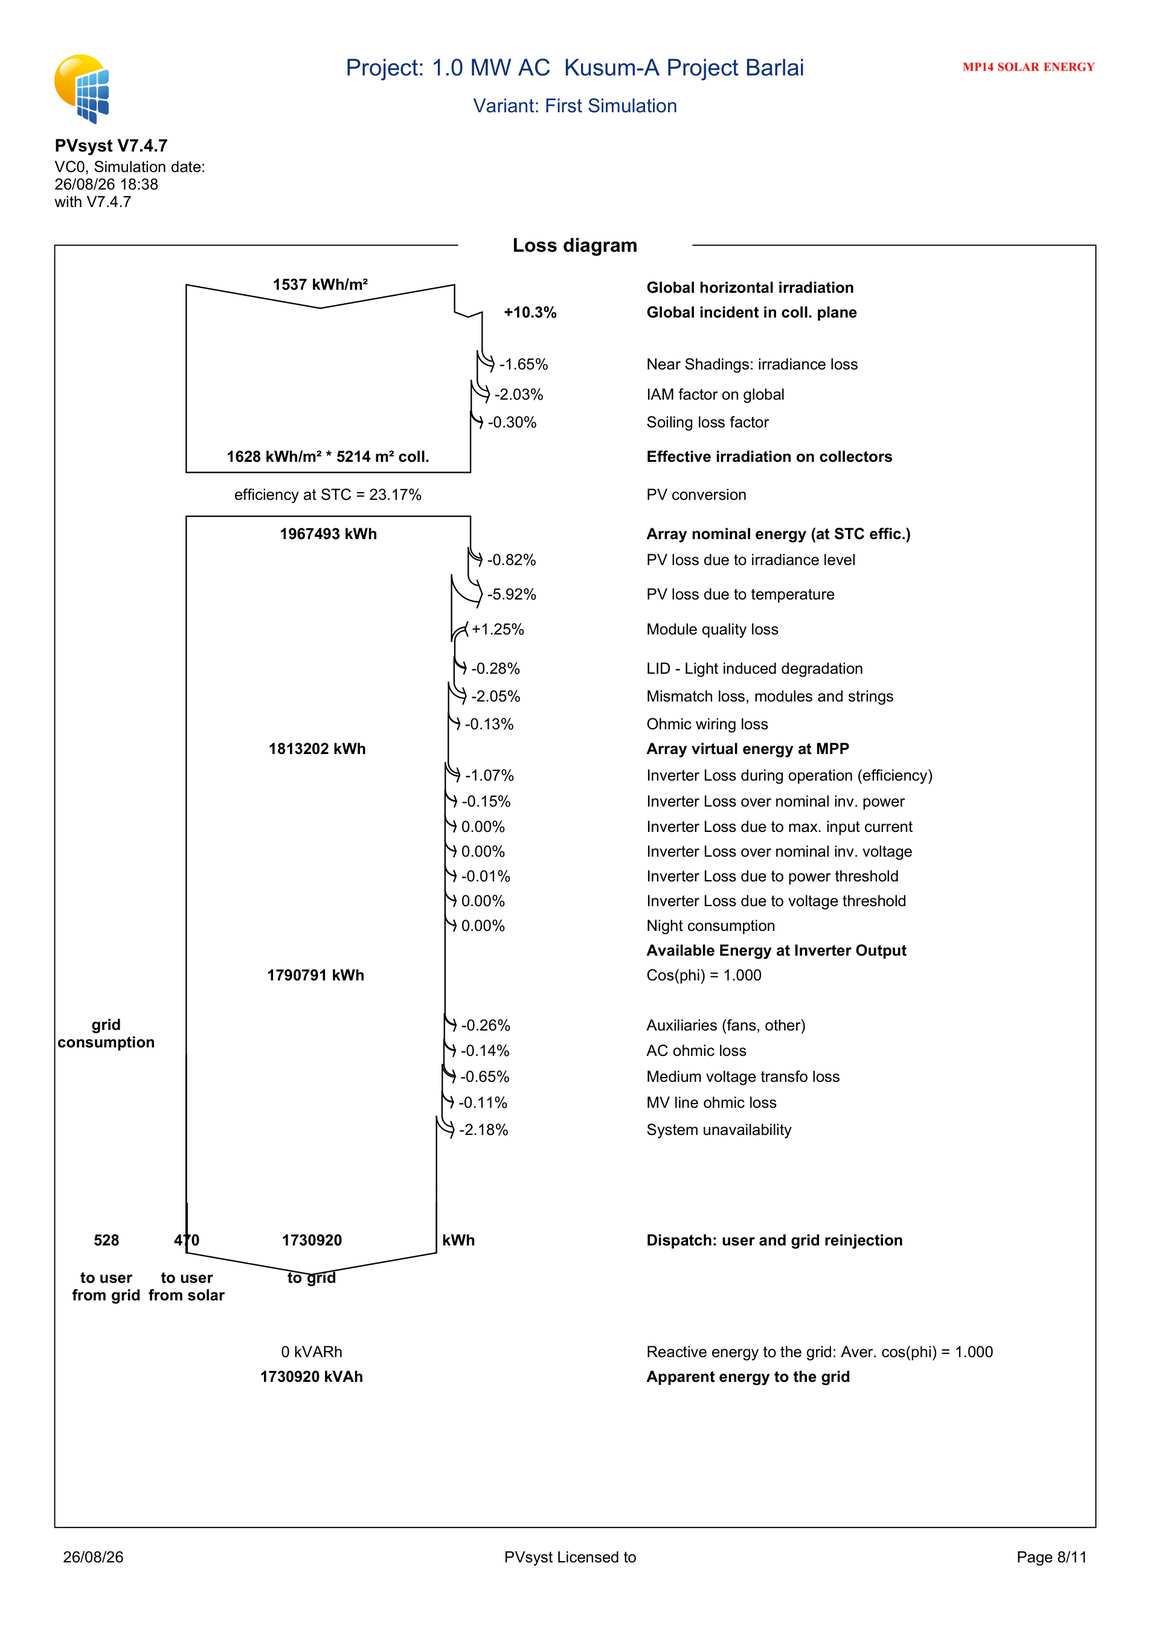
Yield & loss diagram
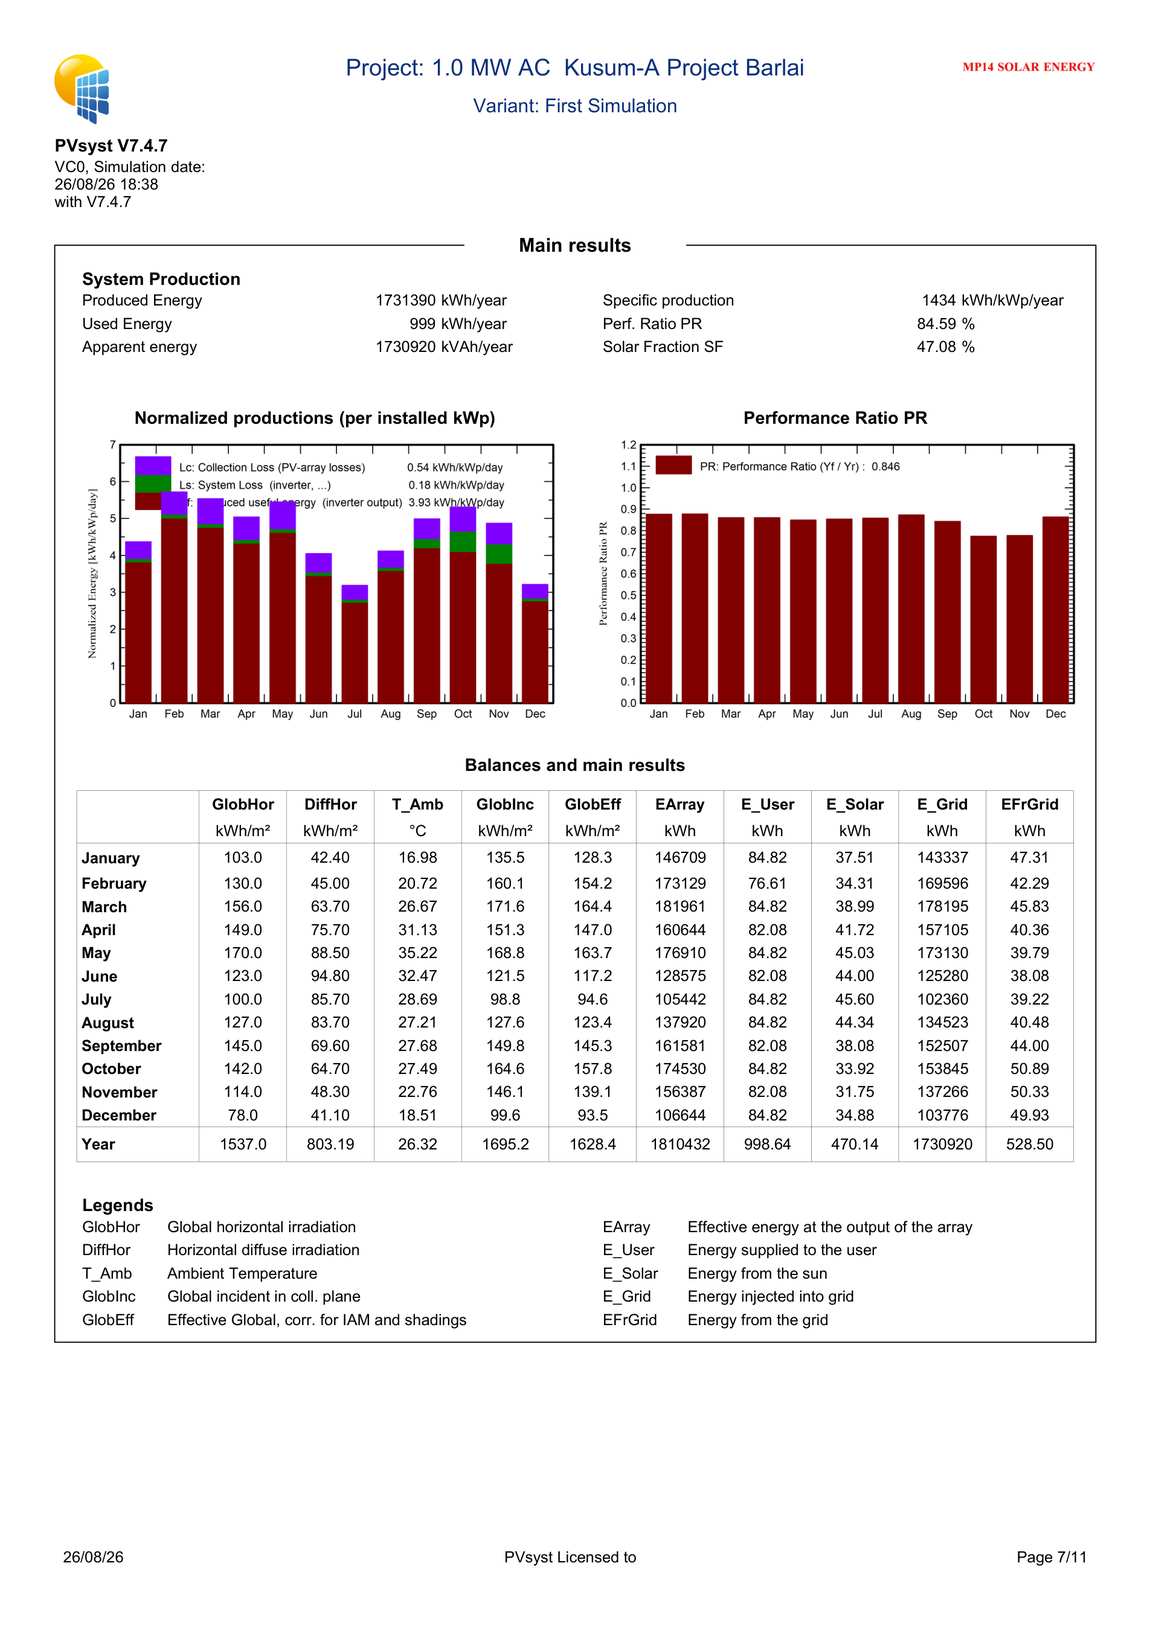
Annual specific yield (kWh/kWp/year), performance ratio, and a full loss-by-loss breakdown — shading, soiling, temperature, wiring, inverter and transformer losses.
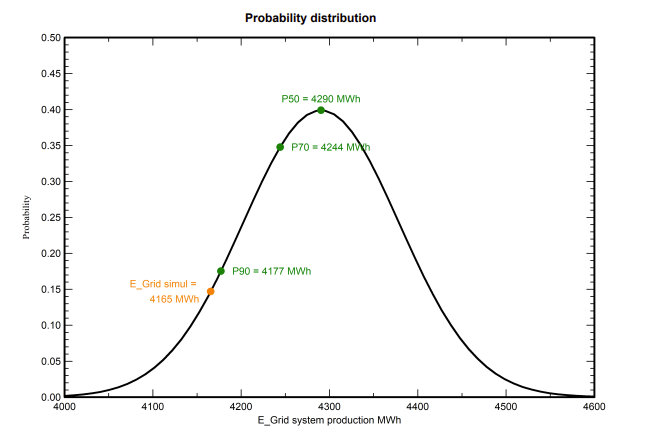
P50/P90 probability
Statistical confidence bands on annual production, so a plant's financing and PPA numbers are built on a realistic range, not a single optimistic figure.
Assessment & layout
Site assessment, layout planning and shadow analysis for both rooftop and ground-mount arrays.
SLDs & stringing
Single-line diagrams, string configuration, inverter sizing and DC/AC cable sizing.
PVSyst yield reports
Energy-yield simulation and sun-chart analysis for optimum panel orientation and tilt angle.
Earthing & LA design
Earthing per IS 3043:1987, lightning-arrester placement and surge-protection design.
Feasibility & ROI
CAPEX/OPEX breakdown, loan/EMI structuring, and ROI & payback analysis — typically 3–4 years.
Execution-ready drawings
Drawings built to support smooth EPC handoff, with no rework at construction stage.